P and S, together at last!
Starting with the events of 2001, the ISC is using S arrival times in computing hypocentres. The use of S times is an important step in improving the results from ISC's data analysis. The large majority of S times being used at the ISC are local and regional phases, Sg and Sn, since relatively few teleseismic S arrival times are reported.
One issue that the ISC had to address is the well known inconsistency between P and S travel times in the J.-B. tables, which are still used at the ISC. But tests showed that, compared to hypocentres computed from P times alone, using S produced no systematic change in depth or epicentre. Based on this result, the Executive Committee concluded that S times will not bias ISC hypocentres.
True locations are not known for a large representative sample of events, so we cannot prove that S times improve ISC hypocentres. But we did compare test results to well-determined hypocentres from national monitoring agencies, which often use region-specific travel time tables. We also compared focal depths with depths computed from pP-P times. Using S times moved the ISC's hypocentres closer to these external standards on average, and moved very few of them away from the standards.
For the ISC, which uses nonlinear weighting to
accommodate outliers, an important advantage from using S is
 improved stability in inversions for epicentres, origin times
and focal depths. As shown in the figure at the right, in first
three months using S arrival times, the proportion of events for
which the ISC could not compute an hypocentre was cut by more
than 1/3 compared with the previous year. With additional
constraint from S times, spurious convergence on local minima
occurs less often. In addition, ISC seismologists need less
often resort to fixing depths and epicentres to reported values.
This increases the proportion of events for which the Bulletin
includes epicentres computed using the ISC's globally consistent
location procedures, weighting algorithm, and travel times.
improved stability in inversions for epicentres, origin times
and focal depths. As shown in the figure at the right, in first
three months using S arrival times, the proportion of events for
which the ISC could not compute an hypocentre was cut by more
than 1/3 compared with the previous year. With additional
constraint from S times, spurious convergence on local minima
occurs less often. In addition, ISC seismologists need less
often resort to fixing depths and epicentres to reported values.
This increases the proportion of events for which the Bulletin
includes epicentres computed using the ISC's globally consistent
location procedures, weighting algorithm, and travel times.
S times were introduced by modifying the ISC's existing location program. Many of the modifications were made by Chen Qi-fu of the China Seismological Bureau, who worked at the ISC for a year as a Royal Society visiting fellow. Richard Luckett made further changes to improve identification of regional S phases and ensure that S travel times are computed accurately.
Seismologists who follow developments at the ISC may recall that Chen Qi-fu's goal in modifying the ISC location program was to use travel times from laterally heterogeneous earth models. Consensus on a 3-dimensional mantle model may still be a few years off but, apart from the effects of subducted lithosphere, much of the variability in travel times is due to crustal structure. But Richard Luckett is investigating the effect that crustal corrections would have on ISC hypocentres. Results from his work using the Mooney-Laske "Crust 2.0" model are likely to be discussed during the ISC's Governing Council meeting at the IUGG Symposium in June.
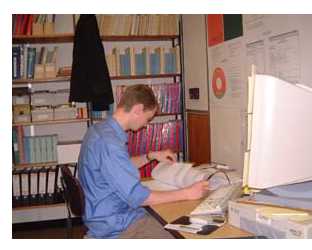 Tom is demonstrating his system in the photo at the right, using
a bar code scanner to record edits. Commands are scanned from a
summary page. Objects of each command, such as hypocentres or
readings, are scanned from bar codes that are now printed in
listings. Advice from Reading faculty with expertise in
human-computer interaction helped in designing a listing format
that could be scanned efficiently.
Tom is demonstrating his system in the photo at the right, using
a bar code scanner to record edits. Commands are scanned from a
summary page. Objects of each command, such as hypocentres or
readings, are scanned from bar codes that are now printed in
listings. Advice from Reading faculty with expertise in
human-computer interaction helped in designing a listing format
that could be scanned efficiently.